Consumers and enterprises alike expect more from software. Speed, UX, availability, and frequency of updates are increasingly important with mobile apps. The responsibility of developers keeps growing, and as mobile apps get more complex, new tools for mobile performance monitoring and testing are being born.
Successful APM tools can provide teams with visibility into what’s happening to users in the real world and address issues in the next app update. But this process usually takes a couple of weeks. During that time, users can get frustrated with performance issues making them more likely to leave a bad review in the app store.
When it comes to having this visibility during development and testing (and avoiding frustrated users), we’re still in the early innings. If you can measure and improve app performance before releasing a new version of your app, it will not only make your users happier but also save your team a lot of headaches, improve developers’ productivity, and allow more time to focus on new features.
This article will help you understand the main mobile performance metrics that are measurable in your mobile native app (Android or iOS) before releasing a new version. That way you can start tracking performance early on and prevent issues from affecting the end user.
Device performance metrics
There are different factors that affect mobile app performance. When it comes to the client-side performance of a mobile app, there are two big areas that you can measure: the device and the app itself. In this first post, we’ll focus on device performance and the metrics related to it.
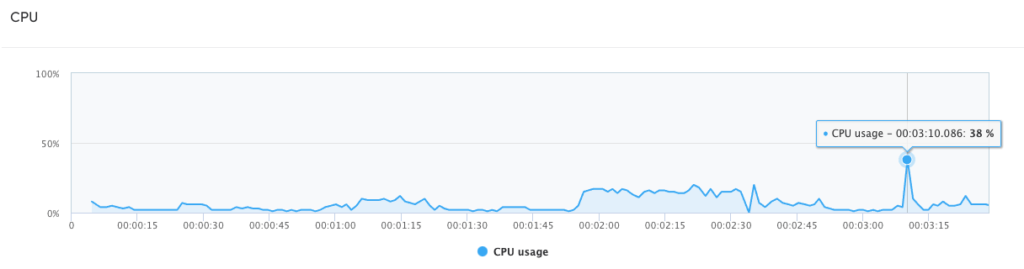
CPU usage
The CPU (Central Processing Unit) is the unit responsible for carrying out all the instructions of an application. This includes how to run different subsystems that keep the OS running, such as multimedia, audio, rendering, and more. When CPU usage is high, the user may experience sluggishness or higher battery usage (among other symptoms). Since CPU usage is a shared resource, abusing it may prevent other services that are running at the same time to work correctly. This can affect the user experience and proper functioning of the OS (plus the applications that run in parallel). Moreover, with a higher number of instructions, the CPU increases its speed with a consequent increase in voltage, which can cause the device battery to drain faster.
As a good rule of thumb, you want to monitor the CPU usage of your app and always keep it below 80% on all testing devices. If you see peaks in CPU usage, you might want to take a deeper look at the root cause and determine whether it’s expected or not.
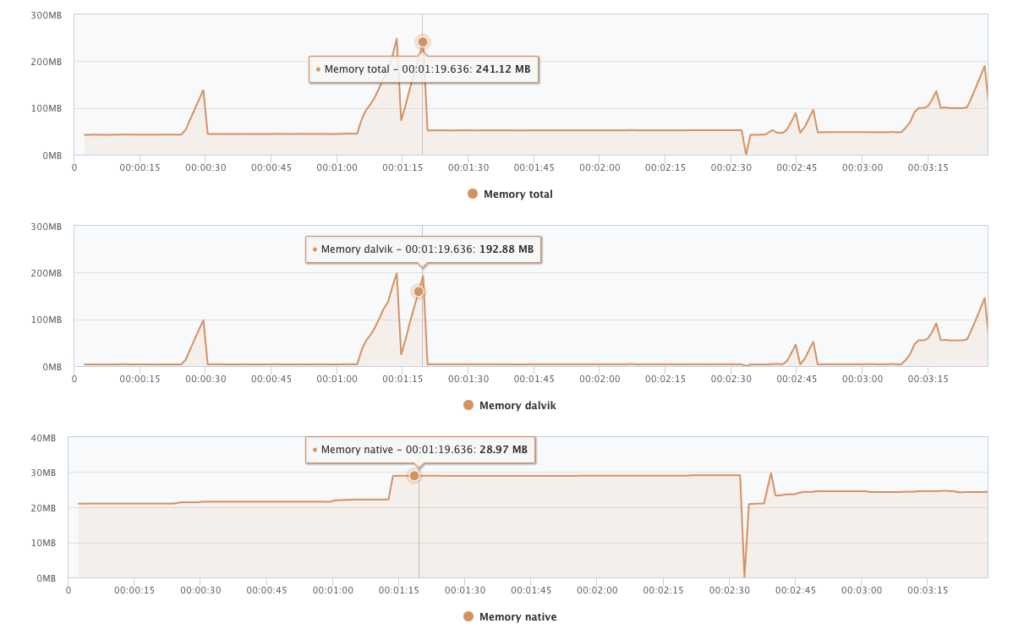
Memory
Random-Access Memory (RAM) is one of the most valuable resources in any software development environment. It’s even more valuable in mobile environments where physical memory is constrained. Retaining memory that the app doesn’t need can cause out of memory (OOM) exceptions or constraints on the system’s overall performance.
Specifically for Android apps, there are three areas of memory you can analyze:
Proportional Set Size (PSS): PSS is the total memory footprint of a process calculated by the Android System. A process will always have a private amount of memory to use plus an extra amount of memory that is shared with other processes. PSS takes these into consideration to provide a fair quota of the app’s memory usage.
PSS = private memory + (shared memory/amount of processes sharing it)
Native Heap: Native Heap is handled directly on the Android kernel and typically stores assets like bitmaps and other native libraries. Native memory handling depends on the frameworks that your app uses and requires more caution when handling and releasing memory as there is no Garbage Collector.
Dalvik Heap: Dalvik Heap is the memory space handled by the Android System (Dalvik or ART). This will typically store all the app’s objects that are created using the Android SDK.
To maintain a functional multi-tasking environment, Android sets a fixed limit on the Dalvik heap size for each app. The exact Dalvik heap size limit varies across devices based on how much RAM the device has available overall. If your app has reached the heap capacity and tries to allocate more memory, it will receive an OutOfMemoryError.
Virtual machines typically count on a Garbage Collector (GC), which is part of most modern programming languages. It’s a mechanism that automatically frees up memory that’s not being used by any thread. Although GC performance is usually improved in almost every new Android version, it can still cause some performance issues. Try monitoring the GC time (the amount of time that this process takes to complete). Issues like excessive memory allocation in the app could lead to higher GC times.
Storage I/O
I/O throughput and latency can vary a lot depending on the device hardware. Many apps use storage or databases such as SQLite for local assets. SQLite is highly optimized for efficient access. It’s a good idea to rely on it when writing and updating existing content.
In any case, measuring the amount of data read and specially written is another important aspect of good performance. The basic measurement is the amount of logical and physical memory used per second by your app.
In our next post, we’ll focus on app performance and the most important metrics to measure.
At Apptim, we want to help companies consistently deliver fast and reliable mobile experiences. It doesn’t matter whether you’re just getting started with mobile performance or you’ve been involved in this practice for some time, Apptim will allow you to easily integrate mobile performance metrics in your current mobile development process. To start measuring the performance of your Android or iOS apps, you can sign up for Apptim here for free.
apptimmobile performancemobile performance testing


Leave a Reply