In this post, we’ll take you step by step through the process of getting started with Apptim and running your first test to improve the quality of your mobile app.

Testing mobile performance can seem tricky and time consuming, but it’s an aspect of the mobile user experience that developers and testers can’t overlook in 2020.
According to Google, 70 percent of users abandon an app because it takes too long to load. Similarly, App Samurai has found that 70 percent of app uninstalls are due to app crashes. These are both negative consequences related to poor mobile app performance that brands must avoid if they want their apps that they’ve poured so much time and energy into making to be a success.
Mobile performance involves measuring, analyzing and optimizing an application under different circumstances, to increase its robustness and reliability.
Apptim can be used during development and testing to catch critical bugs faster and identify performance issues in an app without the need to install an SDK or change the source code.
This makes it easy for manual testers, developers, and even product owners to run a test.
It automatically measures app render times, power consumption, and resource usage while capturing crashes and more on Android and iOS devices, providing developers with the visibility they need to improve performance and enhance the user experience.
Once you’ve installed Apptim, you can run your first test and obtain performance results in as little as five minutes.
Below, we will share how to use Apptim to capture client side performance data using an Android demo app developed by us.
These are the steps we’ll follow to test mobile performance with Apptim:
1 – Install Apptim Desktop
2 – Install the demo app
3 – Run a test
4 – Review and share your results
1 – Install Apptim Desktop
There’s a simple two-step process to configure Apptim Desktop.
First, you can create an account on the Apptim website and then download the Windows or iOS desktop application. Apptim requires installing some dependencies, which it will list for you, and after clicking “Install Dependencies,” it will begin to install them for you if they are not already installed on your computer.
After the installation process is completed, you will see Apptim’s home screen.

2 – Install the demo app
You can download the Android demo app from here. Then, connect your Android phone to your PC or Mac using a USB cable. Make sure to follow these instructions to correctly allow Apptim to access the device later in the test.
If you were to test an iOS app, you would follow all these same steps, except instead of connecting an Android device, you would use an iPhone or iPad and your Mac.
You can install the demo app in the Android device by executing the following command from the Terminal in Mac or Command line in Windows: adb install <apk_path>
Make sure to run this command from inside the ../android-sdk/platform-tools/ folder or add the Android SDK directory to your path.
3 – Run a test
Once you have the demo app installed in your device and the device is connected to your PC or Mac through USB, you are ready to start a test with Apptim!
Go to Apptim and click “Start a new test,” it will ask you to select your mobile device and then you can choose the app on the device that you want to test or search for it by name. Here you will search for “ReferenceApp” and then choose the app from the list.
Then, it will ask what type of test you’d like to run. Currently, only exploratory tests are supported, but in the future, there will be the option to run a bot test.

Next, it will ask you to add a name to your test and press “Start” to begin your exploratory testing session.
During the test
At any moment during your testing session, you can choose to report a bug or take a note. You can end your testing session anytime by clicking on “End Session.”
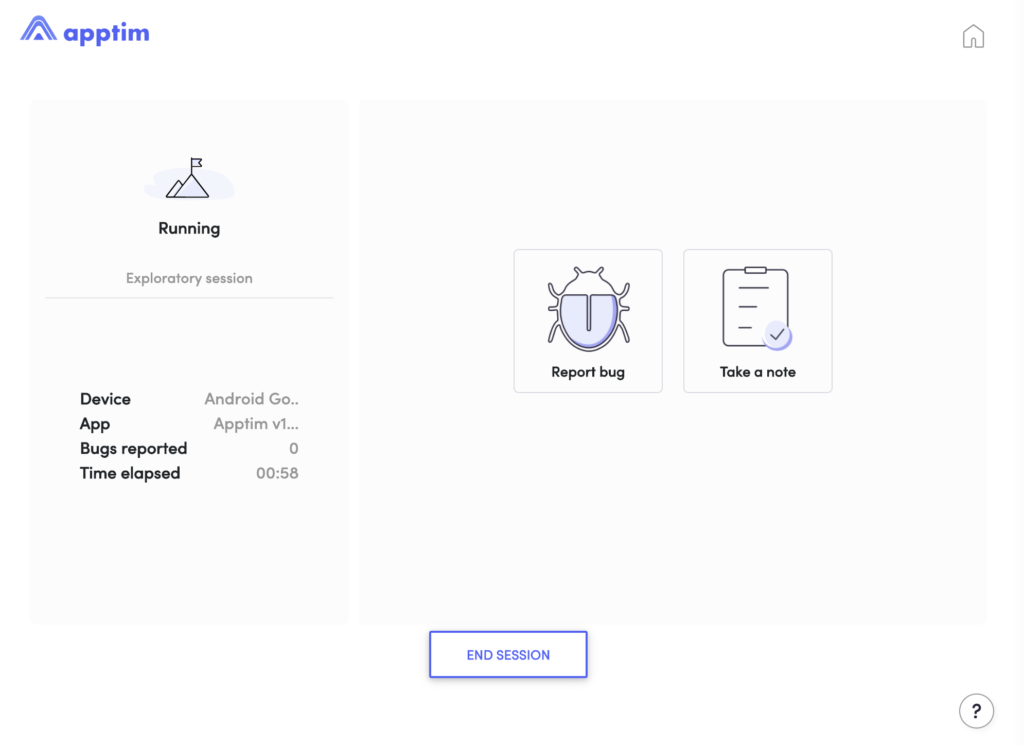
Report a bug
When you click on “Report bug,” you will be prompted with a new screen where you can give the bug a title and description, add a tag, and attach a video and screenshot that were automatically captured. You also have the option to edit the screenshot.
Take a note
When you click on Take a note, you will be prompted with a new screen where you can write a Note, a Risk identified, an Idea, or just a To do as a reminder for later. You can also attach a screenshot.
Review session
Once you end your testing session, you will see a summary with bugs, ideas, risks, and notes taken.
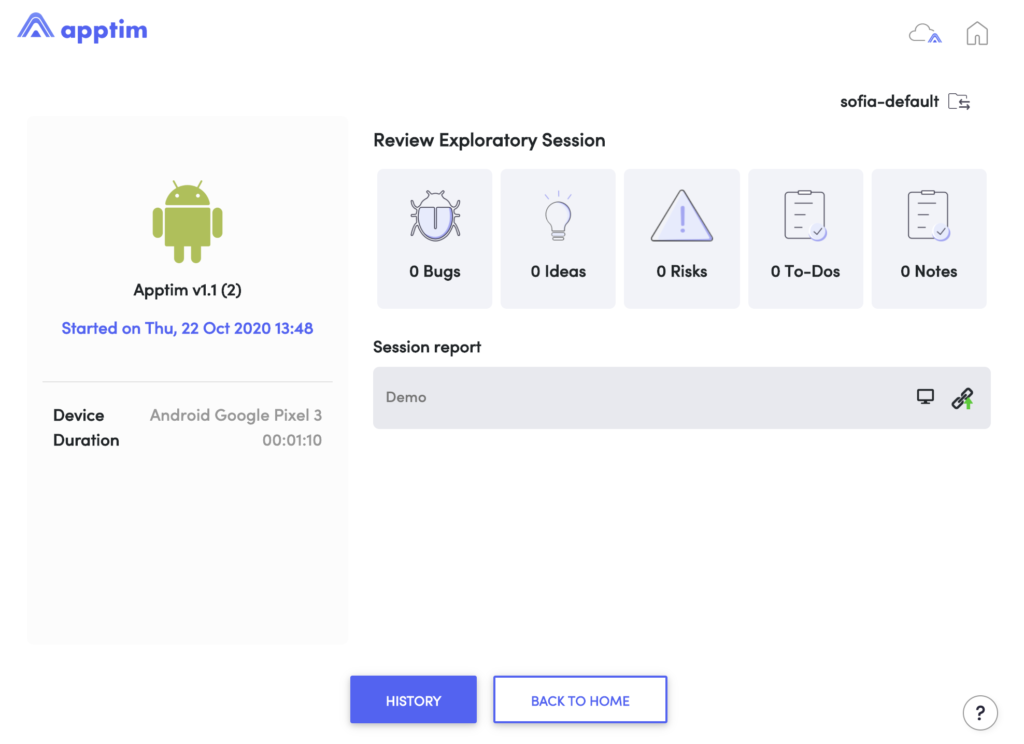
Here you will also have a list of all bugs captured and within each bug, the option to publish a bug to your workspace and publish a bug to Jira.
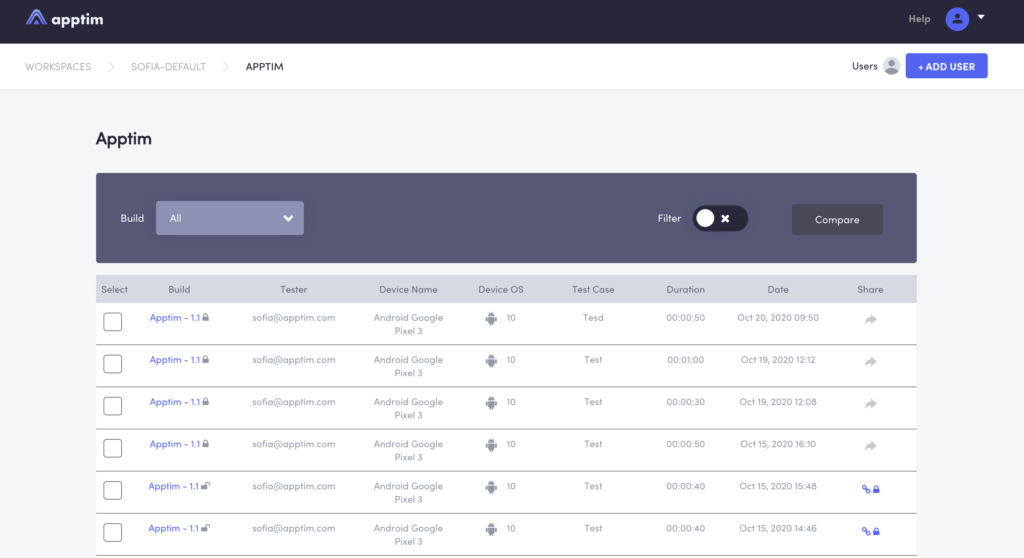
4 – Review and share your results
Once you’ve finished your test session, Apptim generates a report with a summary of all of the performance data that it has automatically captured for you while you were testing the app’s functionality.
You can publish the test session report to your workspace in the Apptim Cloud and then share it with other team members. You have the option to share it privately, by adding team members to the workspace, or publicly, by generating a link.
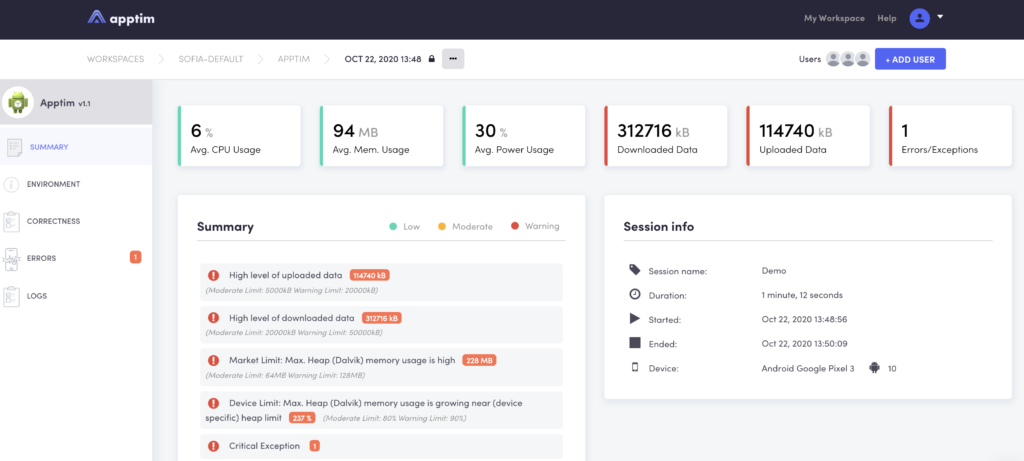
In each Apptim report, you’ll find:
- A screen recording of the device during the execution of the exploratory session
- Alerts and warnings related to the user experience (nested layouts, screen controls, rendering times, etc )
- Alerts and warnings related to the usage of device resources (CPU, Memory, Threads, Power Usage, Network Data), with reference thresholds, shown in yellow or red depending on their severity
- Test environment data (device, app, version info, etc)
- Crashes/exceptions details with associated screenshots, and the exact minute of the session in which it happened in order to locate the specific moment in the video
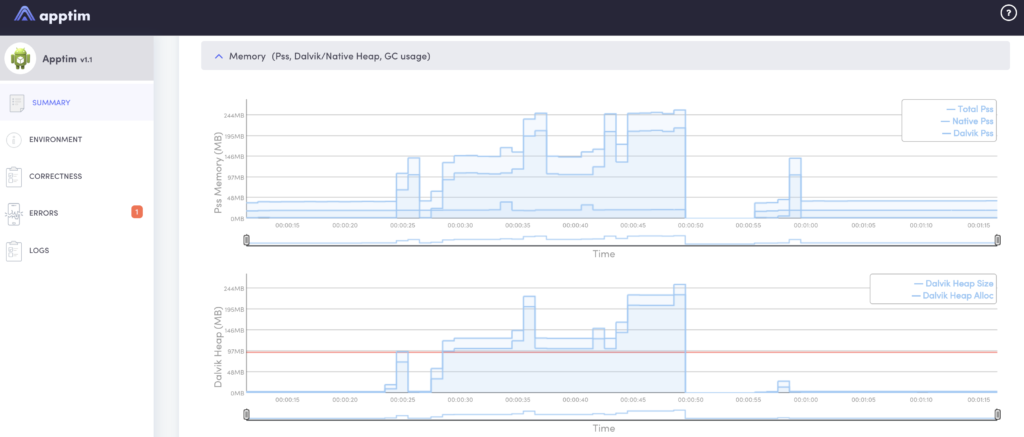
- Detail of resource usage with associated graphs
- Logs and downloadable artifacts collected during the test
Here are some screenshots of what an Apptim Report includes:
Here you can also see an example of an iOS Apptim report.
To learn more about these different mobile performance metrics, check out this article. To understand more specifically about understanding Apptim reports, check out these docs.
To see us run a test with Apptim in action, check out this demo video:
About Apptim
These days, mobile performance is more crucial than ever, but it’s also a challenge to gain visibility into all of the factors that impact it. Apptim provides easy-to-read reports for developers to check mobile app performance, review logs, and crash details. Teams can now release new versions of their app with confidence by getting full visibility on app performance trends.
Features:
- Native app testing: Apptim evaluates the performance of native Android and iOS mobile apps while running them on real devices.
- Performance and bug reports: After each test session, the tool generates a report with the performance metrics and bugs that you may find during your test session with Apptim.
- Out-of-the-box JIRA Integration: Publish and track bugs directly in this project management tool.
- Easy to use: Apptim’s user interface is elegant and intuitive, making it a simple tool to use. In addition, on the website you can find detailed documentation that will help you through your first steps with the tool and you have support available every step of the way.
- Compare two test sessions: If you repeat a test for a particular feature once a new version of your app is ready, you can compare the results to see if there are any big differences in the performance.
apptimhow-tomobile performance testingWe hope you found this article useful and feel better prepared to start improving your mobile app’s performance!
Create an Apptim account today and try it out for yourself!


Leave a Reply