Over the years, we’ve seen many crazy expensive approaches to measuring performance, such as running load tests on the backend while executing the app, automating test cases with different network connections and measuring performance from the test itself.
It’s so expensive to measure app performance on pre-release stages that most companies release their apps and wait for real-world feedback.

In a world where mobile teams strive to avoid releasing bad UX to users, there should be more efficient ways to control UX and performance in CI/CD.

Isn’t this what developers expect when they add tests to CI/CD?
> git push and voila! Performance regression tests are run to ensure the performance is as bad as the previous version (but no worse) 😅
We’ve helped dozens of mobile teams overcome this challenge, and in this article, we’ll show you the minimum steps required to get started with app performance in CI/CD using Apptim.
Let’s break down the solution into four main steps:
1 – Define and measure KPIs for User Experience
2 – Set up an environment and baselines
3 – Working with CI/CD
4 – Monitor alerts and trends
TLDR? Check out our guide on ‘how to add performance tests to your pipeline in 30 minutes‘
1- Define and measure KPIs for User Experience
The first step is to choose the UX KPIs that matter most for your app and business. Performance KPIs can be divided into two categories:
App performance and response times measured from the end user perspective, for example:
- Measure app size that affects download and installation times
- App startup time: how long it takes for the app to launch and when it is ready for the user
- Transaction and event times: the actual time it takes a user to complete a task or a single step, such as logging in, searching, or checking out.
Device Performance data, for example:
- FPS (Frames per second) is one of the top KPIs in gaming apps
- Memory consumption, CPU usage, and battery draining are important metrics for almost any app, especially for those running on low-end devices (hi Android users!) or using these resources extensively.
- For apps that need to work seamlessly online, network usage is also imperative.
These are the most common KPIs for most apps, but there are many other KPIs and each team will prioritize them differently based on their business and users. Learn more about other KPIs here.
In most cases, app performance values are collected by instrumenting the app. SDKs or libraries help mobile teams track and measure these values over a variety of devices and then make decisions based on the results. They are commonly used in production environments (APM/Analytics).
Apptim allows developers to instrument their apps with just a single line of code using native loggers, eliminating the need to add another library or SDK to their stack. Learn more here.
In order to obtain device performance data under specific scenarios, developers rely on their IDEs native profilers. Apple developers can use XCode Instruments whereas Android developers use Android Studio Profiler. This is helpful for developers who manually measure KPIs in a local environment, but how do you measure these KPIs in a CI pipeline?
Apptim agent is a multi-platform tool that measures iOS and Android performance on real devices without having to use IDEs or SDKs.
2- Set up an environment and baselines
The approaches mentioned above are good starting points, but they weren’t built to be integrated into a DevOps environment, because of the number of dependencies and integrations required to run these processes in CI/CD, for example:
- Choosing and provisioning real devices in the cloud
- Selecting which KPI to analyze, testing scenarios and network conditions
- Establish the baseline for each KPI to be compared in every new build
Choosing and provisioning real devices in the cloud
Choosing devices is fairly straightforward if you have information from real production users. Alternately, most companies will begin with one low-end device (1 or 2GB of RAM). Provisioning is much easier with real device clouds, and there are plenty of options today including AWS Device Farm, Saucelabs, and BrowserStack.
Selecting which KPI to analyze, testing scenarios and network conditions
It is important to keep the following in mind when selecting a test scenario to exercise the app:
- Small and easy to maintain
- Exercise the KPI(s) to measure
For example, to measure app size and startup time, you need only an app (ipa or apk) and a device to install it on. Then, you can launch the app and measure startup time across different platforms (Android | iOS).
Here’s how to do it with Apptim: Startup Time Tests in Android | Startup Time Tests in iOS
In e2e tests, you can use any UI test automation framework that suits your needs.
Establish the baseline for each KPI to be compared in every new build
You can establish the baseline based on the previous results of each KPI once you have run several tests with the same device, for example:
- Memory max limit: 500 MB
- Startup time limit: 1.5 s
- App size limit: 90 MB
- Login time limit: 3 s
3- Working with CI/CD
Once you have selected the devices, the test, and a way to measure the KPIs, it’s time to put everything into a CI pipeline.
In our experience, many companies get stuck here, since running tests in CI means that:
- The tests are robust and repeatable
- Tests run fast enough to provide feedback quickly
- There are defined baselines and a pass-fail criteria for the pipeline to follow
To accomplish this, you can write your own test runner and implement a custom mechanism for determining whether the pipeline passes or fails, or you can use Apptim-cli.
Apptim-cli is a cross-platform client that executes tests on CI/CD by integrating Apptim agent with pass-fail criteria for each build. With CI tools such as Github Actions, these kinds of tests can be run even more easily simply by defining YML files for the KPI thresholds (baseline) and this Github action.
4 – Monitor alerts and trends
As soon as the tests are completed and data is gathered, a popular option is to push the results to prometheus, and manage your own metrics, alerts and notifications in a centralized manner.
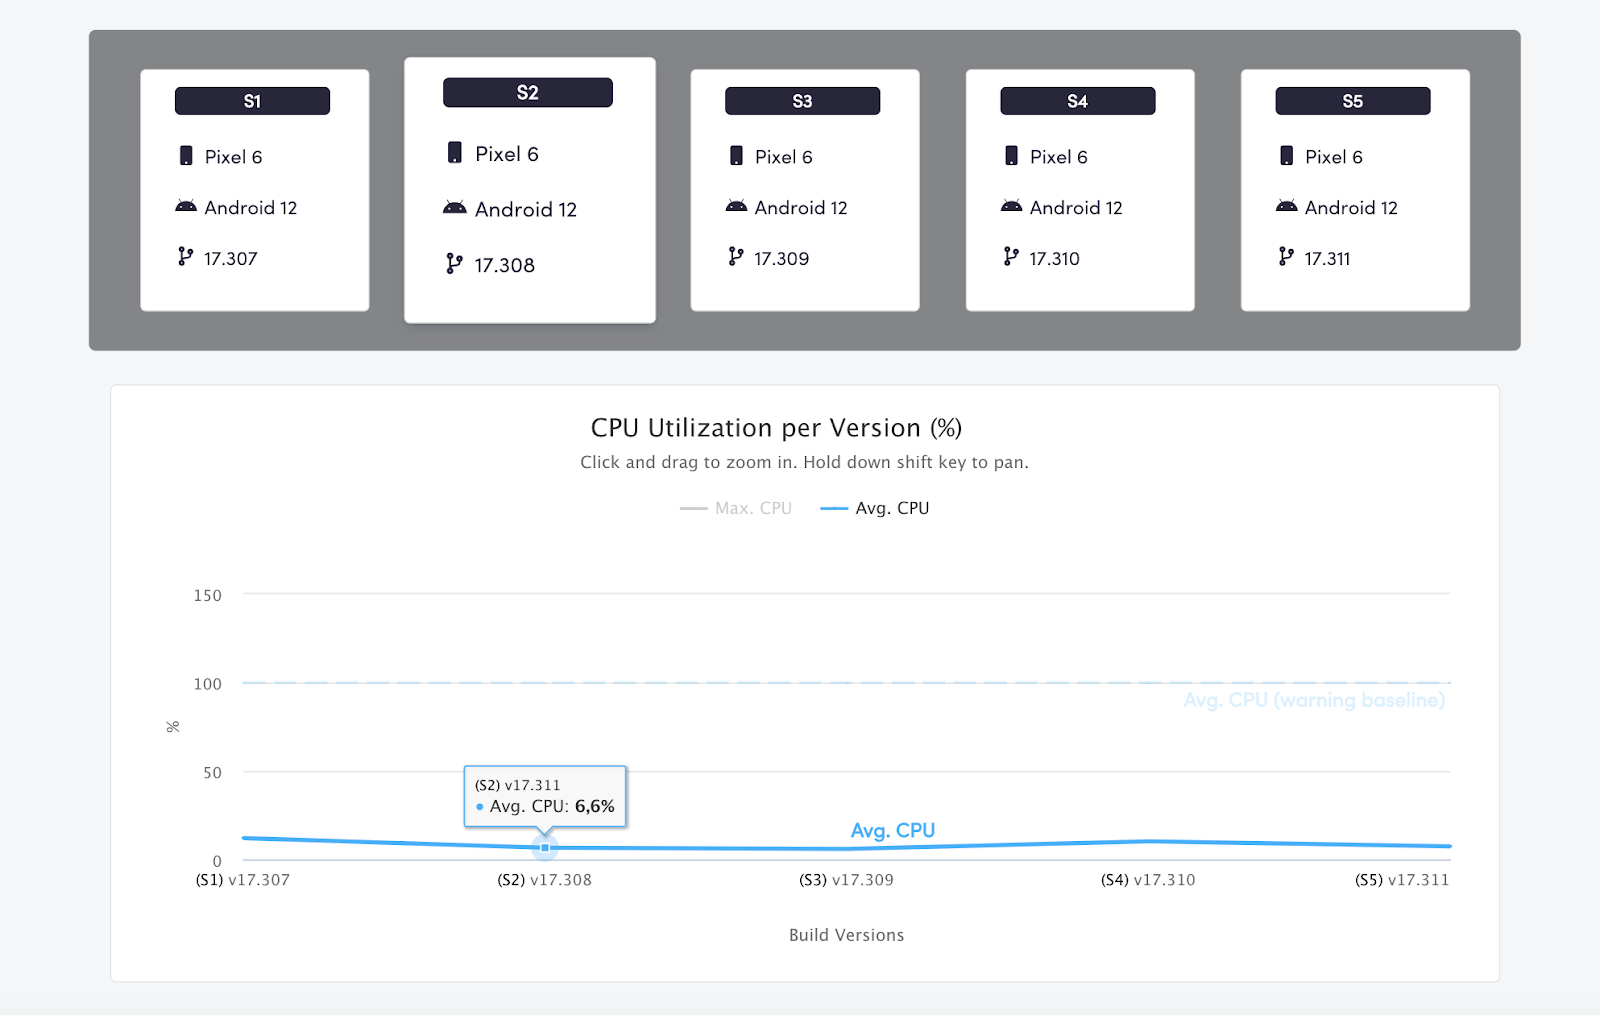
Apptim also provides trend and KPI analysis, so you can see how these KPIs change over time. For example, if you are running a test scenario where CPU usage is a key KPI, you will see how CPU usage changes over different app versions:
Now that you learned the minimal steps required to measure app performance on pre-release stages, are you ready to put this to work in your pipeline in less than 30 minutes? Follow this guide to see how!
apptimCICDmobile performanceux

Leave a Reply